About data quality insights
What is this red, orange or green A, B, C, D, E displayed on my product edit form?

This is the quality score calculated thanks to the data quality insights feature!
Because rich, coherent and consistent product data is important in order to deliver great product experiences, we introduced the concept of "data quality" in our PIM.
This new capability helps you measure your data quality along two axes: enrichment and consistency.
Each of these two axes take into account several criteria to come up with an overall quality score for each product of your catalog.
How is the quality score calculated?
The enrichment axis takes into account:
- The percentage of attributes with values in your product edit form (whether the attributes are required for completeness or not).
- Whether your product is illustrated by at least one image (an image is a must-have for a compelling product description).
The consistency axis (Enterprise Edition only) is a mix of the following criteria:
- Spell check: localizable text and text areas, attribute labels and attribute options are checked for spelling mistakes.
- Uppercases formatting: the PIM checks whether text area attributes are correctly formatted for upper cases.
- Lowercases formatting: the PIM checks whether text area attributes are correctly formatted for lower cases.
Spell check is available for the English, French, German, Spanish, Italian, Dutch, Danish, Swedish, Norwegian and Portuguese (Brazilian) locales. Spell check is usable with localizable text and text area attributes. If you use a single locale, then spell check is usable on text and text area attributes.
What does the quality score mean?
The quality score calculates the achievement.
- A means "Excellent": 90 to 100% of the data quality criteria are fulfilled. You may still have little improvements to make to reach perfection but you have done a tremendous job already.
- B means "Good": 80 to 89% of the data quality criteria are fulfilled. This already is a good achievement, you can definitely go to the next level by following the PIM's recommendations and craft a first-class catalog.
- C means "Average": 70 to 79% of the data quality criteria are fulfilled. Follow our recommendations whether in the dashboard or in the data quality insights panel of the product edit form to improve your data quality.
- D means "Below average": 60 to 69% of the data quality criteria are fulfilled. Don't give up, we are here to help: check the key indicators to see where you should focus your efforts.
- E means "To improve": 0 to 59% of the data quality criteria are fulfilled. You may be at the beginning of a project with a lot of enrichment to do or have lots of new products to enrich. Another explanation might be irrelevant attribute groups activated, such as ERP data, which might downgrade your quality score.
By disabling specific attribute group, you can focus your effort and progress on the most relevant product data for your end-customer needs. Therefore, you will get insights on what’s truly important to improve your product experience.
Where to see the quality score?
The quality score is displayed as badges on various PIM screens.
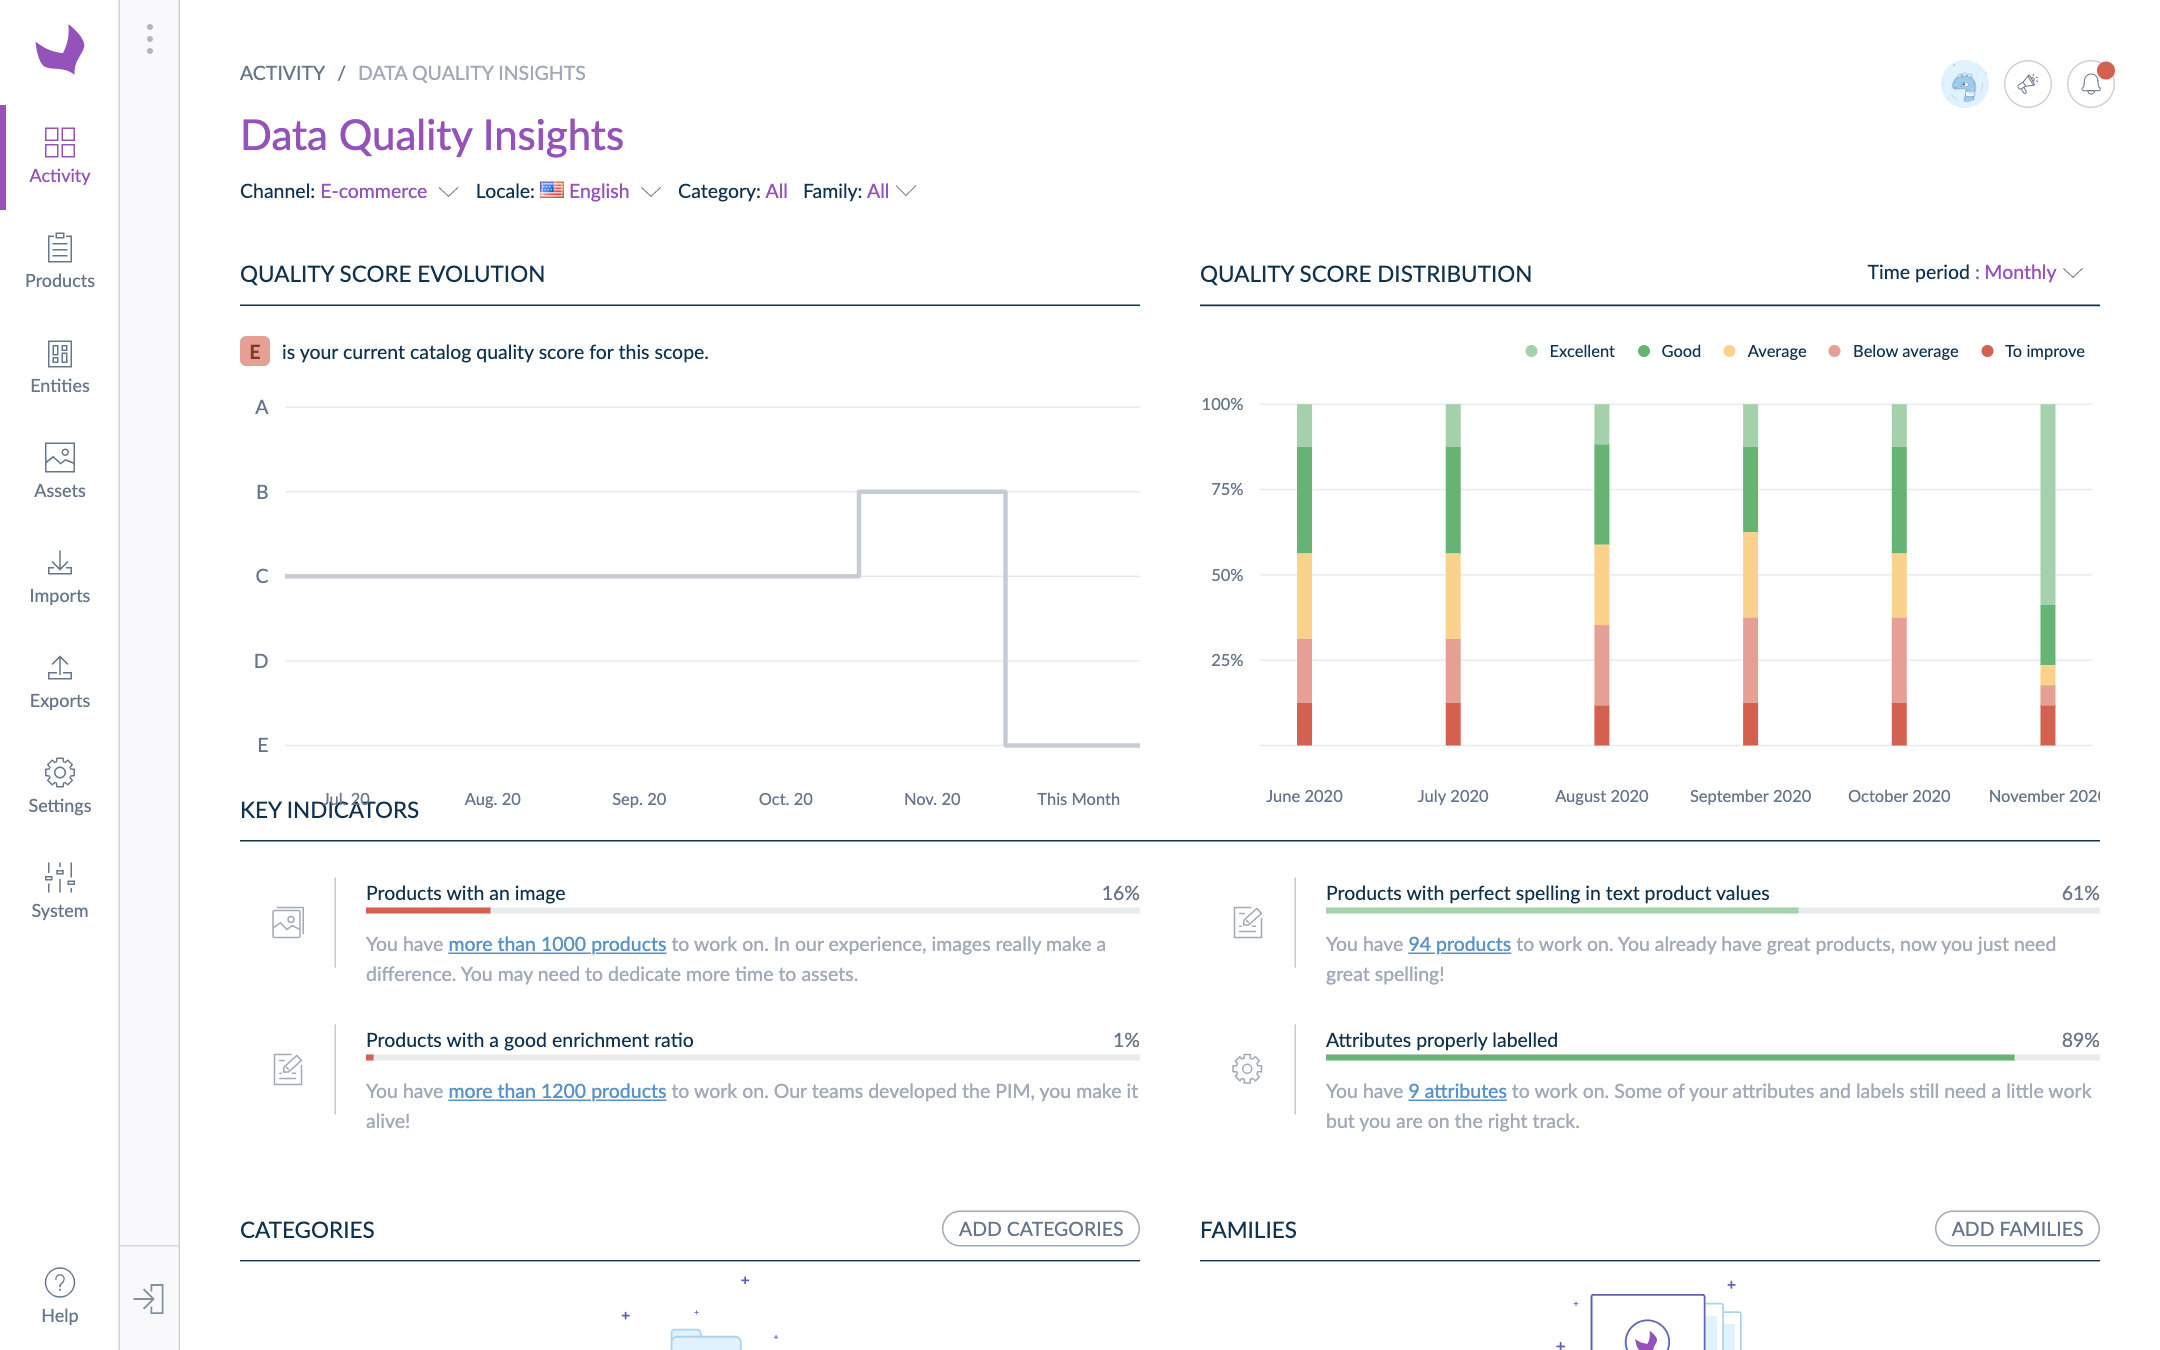
On your data quality insights dashboard
Your data quality insights dashboard offers multiple ways of measuring your catalog's data quality. You can choose to view data quality on the whole catalog, on a family, or on a category.

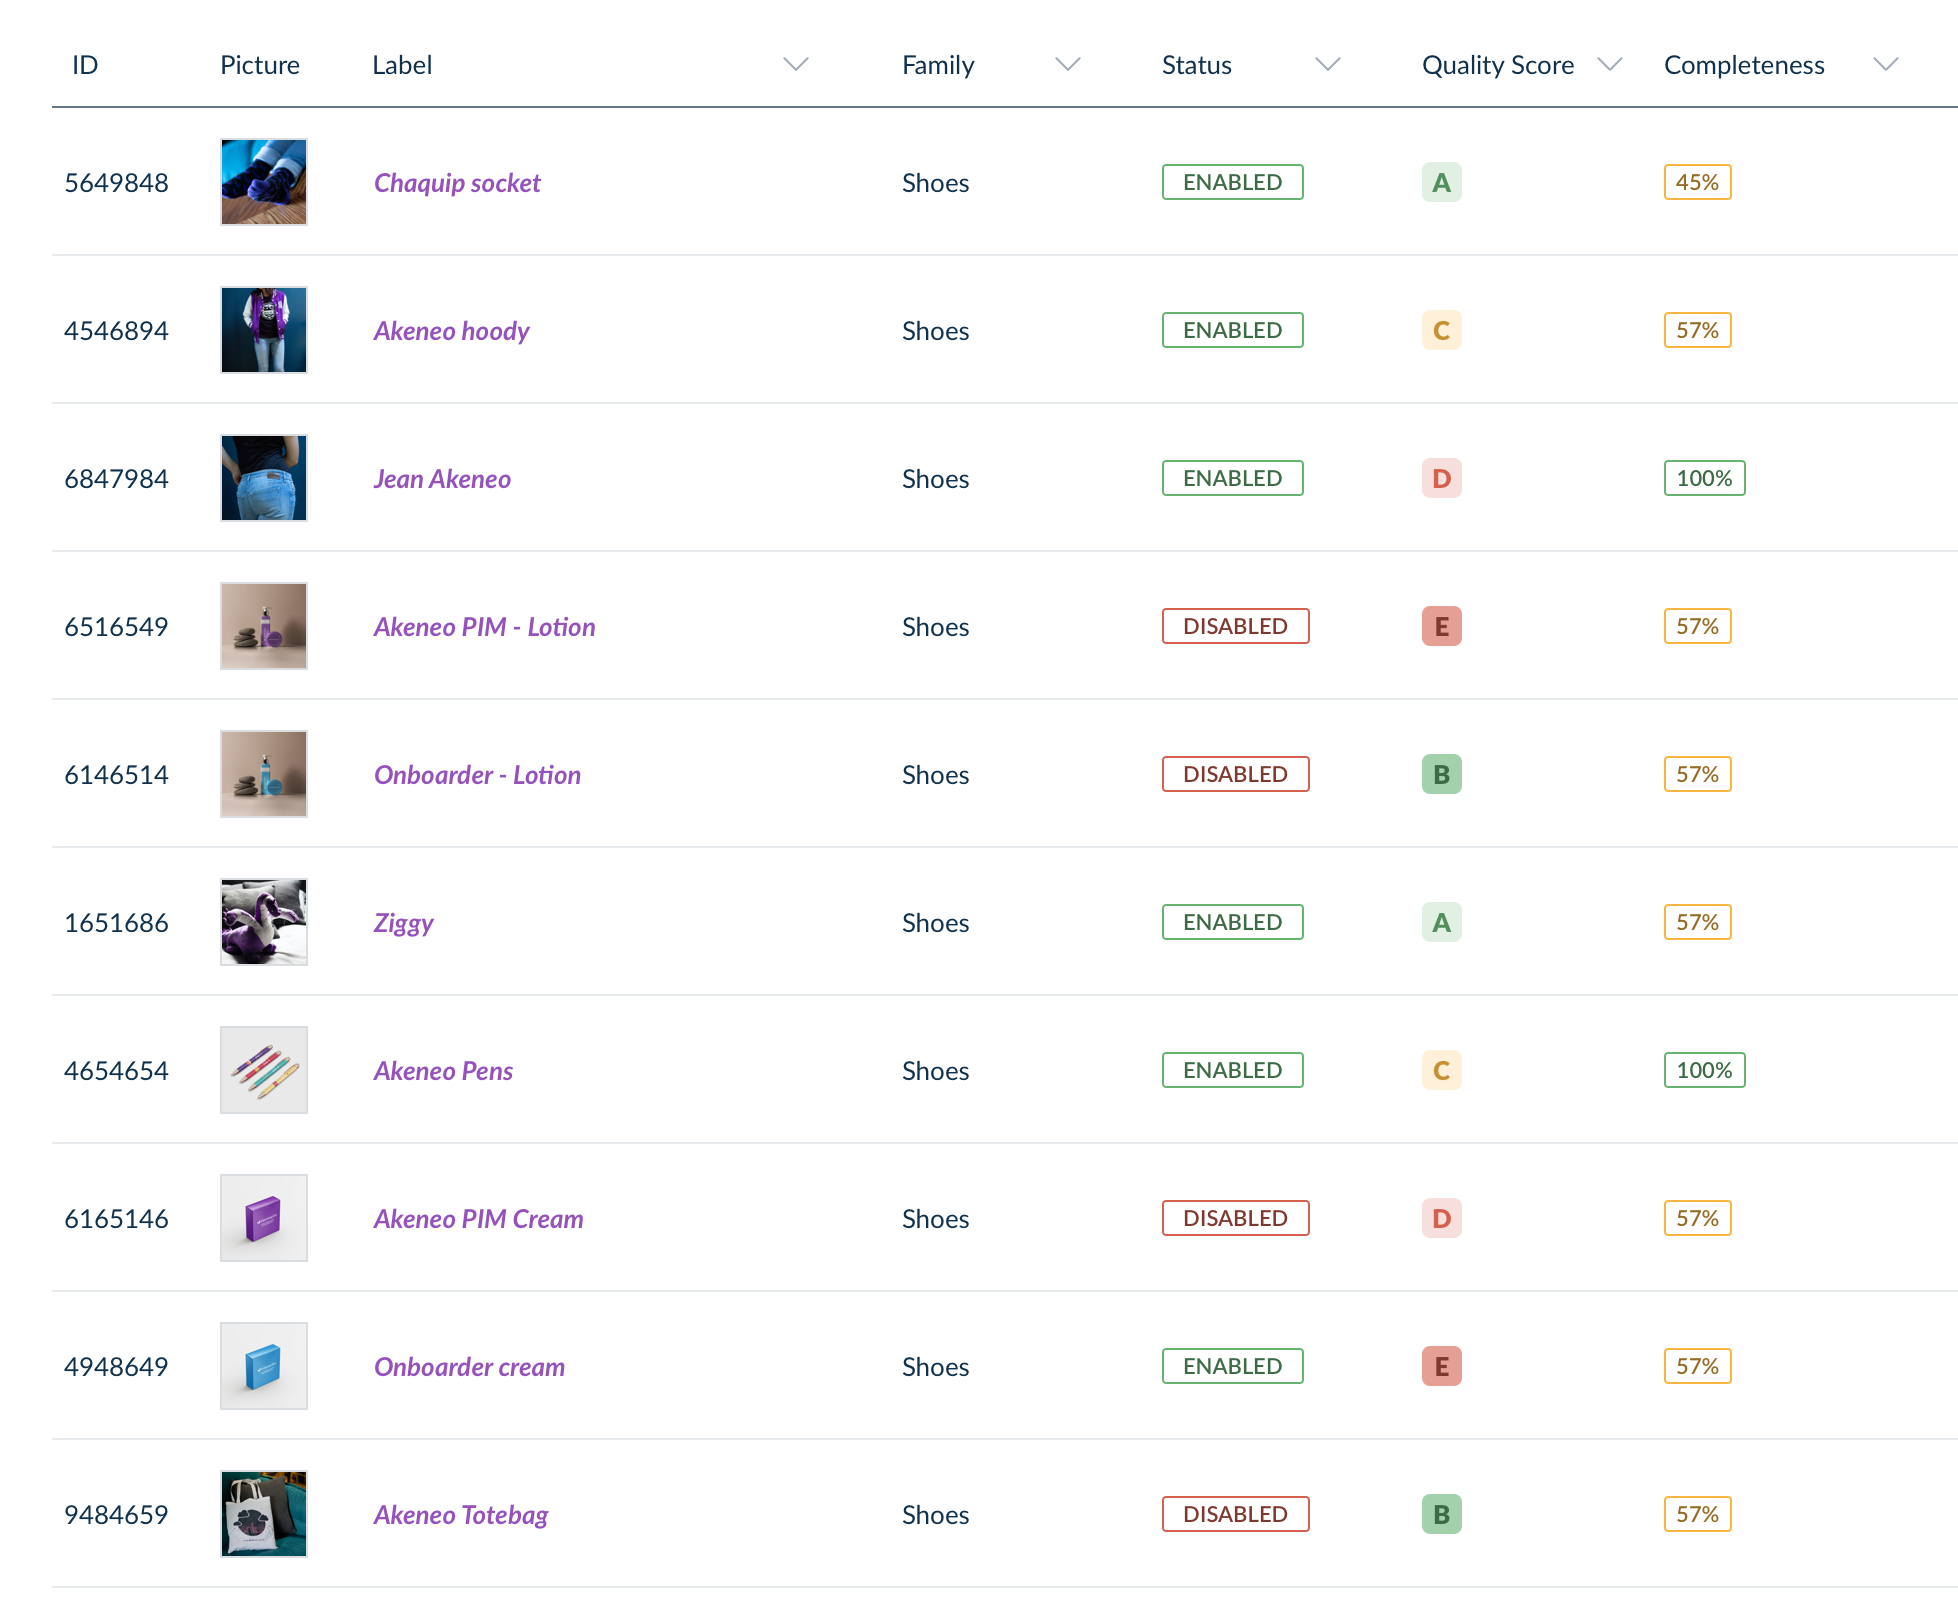
In your product grid
Your product grid displays the quality score for each product.

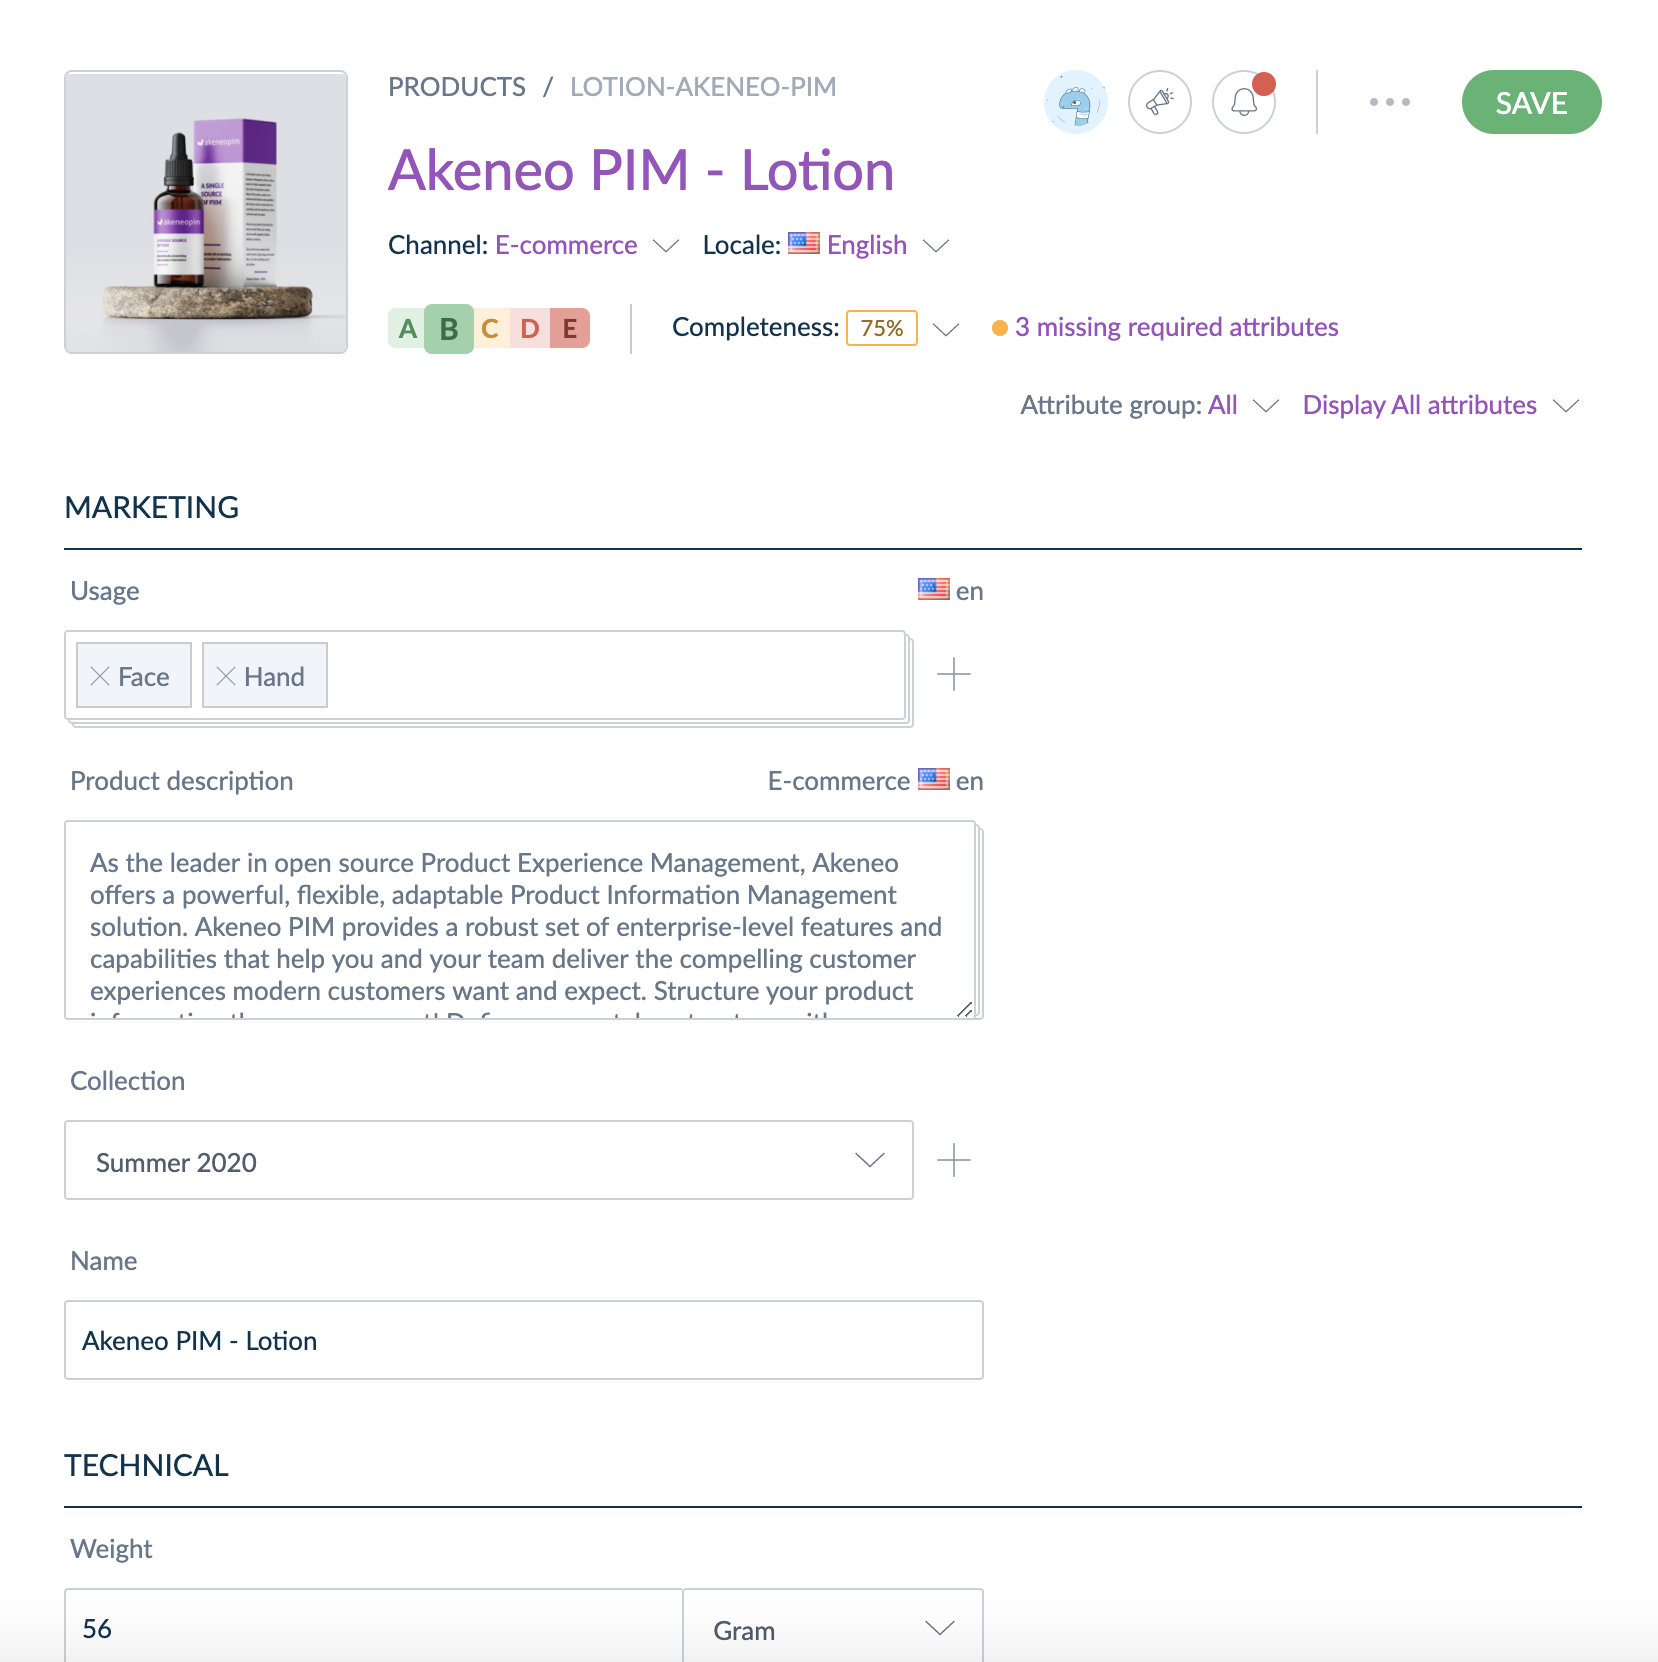
On your product edit form
Your product edit form displays the quality score for each product.

If all the attribute groups of your family have been disabled, the quality score will not be calculated for your product.
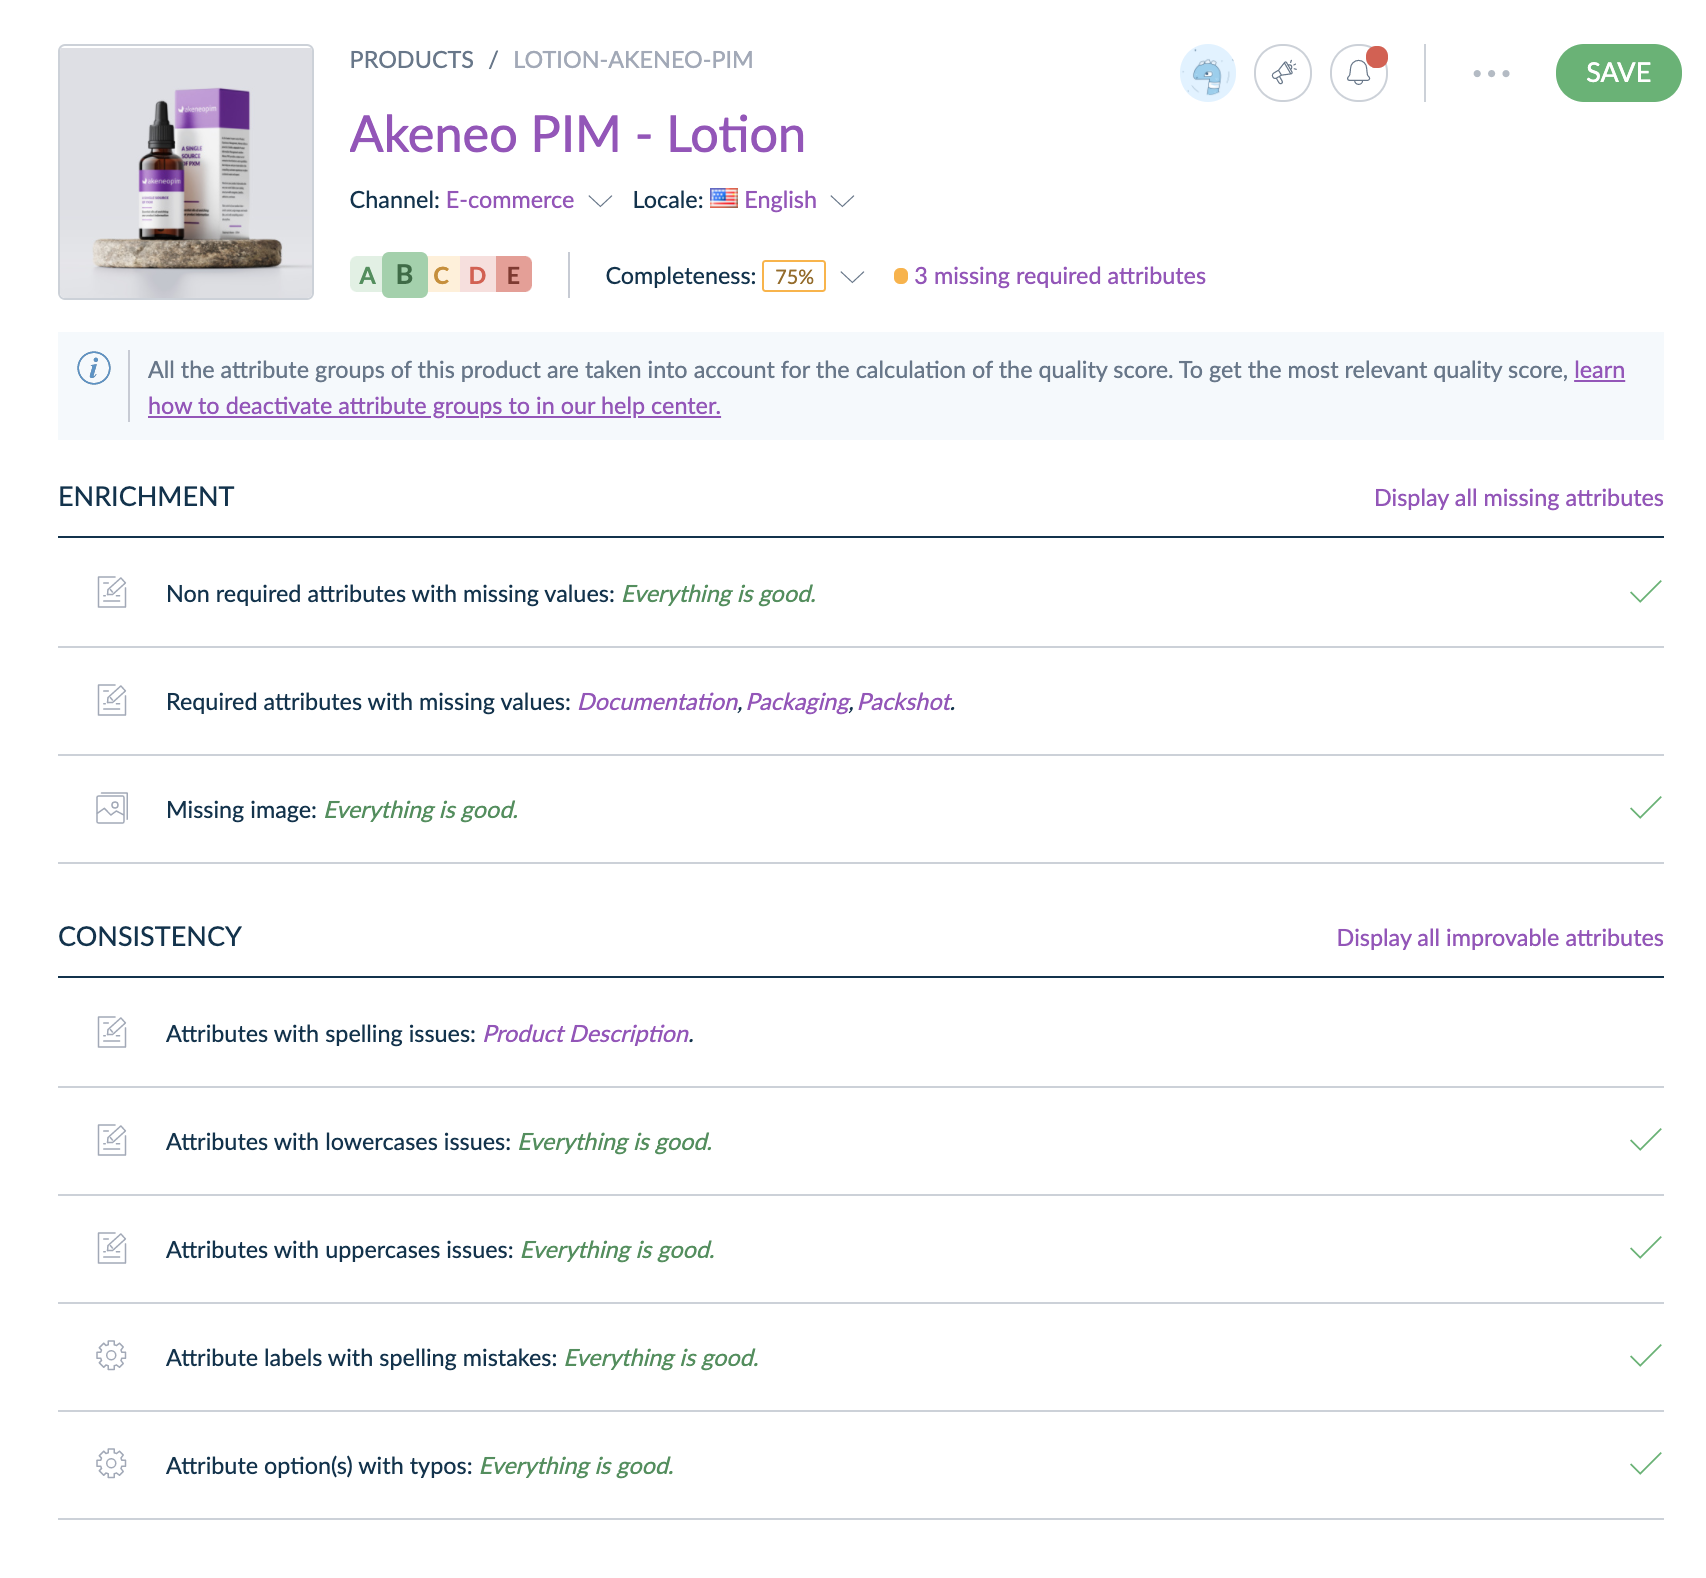
In your data quality insights panel (product edit form)
Clicking on data quality insights in the product edit form takes you to a dedicated panel where you'll find recommendations to understand your quality score and improve it if needed.

There are several types of recommendations:
- "Everything is good": all the checked attributes are correct.
- "Attribute label": attribute labels are clickable so you can improve them easily.
- "N/A": if the recommendation is "N/A" (Not Applicable) it means that the criteria is not relevant for the given product. For example, "N/A" will be displayed for spell-check if you don't have any localizable text or text area attributes.
- "In progress": the criteria is being checked.
How often is the quality score refreshed?
The grades are updated whenever there is a change in the product data:
- after an import,
- after an attribute or option is saved,
- after a product is saved.
Depending on the amount of data, refreshing the quality score can take anything from a few minutes to several hours in order to calculate all the impacts of a modification in the following cases:
- after an import: all products are assessed,
- after an attribute or option is saved: the impact is calculated on all the products holding the attribute or option,
- after a product model is saved: the impact is calculated on all the product variants belonging to the model,
- after an attribute group activation or deactivation: the impact is calculated on all the products belonging to families with the updated attribute group.

